

We’re pleased to announce that Shiny for Python v1.6 is now
available on PyPI
!
Install it now with pip install -U shiny.
This release has two big additions: toolbar components for building compact, modern UIs, and OpenTelemetry support for understanding how your apps behave in production. A full list of changes is available in the CHANGELOG .
Toolbars#
Toolbars are a new set of compact components designed to fit controls into tight spaces — card headers and footers, input labels, and text areas. They’re perfect for dashboards that are running out of room, or for AI chat interfaces where you want to add controls without cluttering the layout.
The core components are:
| Component | Description |
|---|---|
ui.toolbar() |
Container for toolbar inputs |
ui.toolbar_input_button() |
A small action button |
ui.toolbar_input_select() |
A compact dropdown select |
ui.toolbar_divider() |
A visual separator |
ui.toolbar_spacer() |
Pushes items to opposite sides |
Each input also has a corresponding ui.update_toolbar_input_*() function for updating it dynamically.
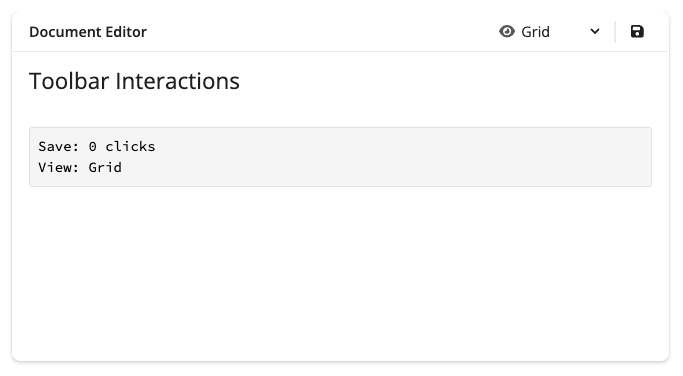
Toolbars in card headers and footers#
The most common use case is placing a toolbar in a card header to attach controls directly to a card’s content:
|
|
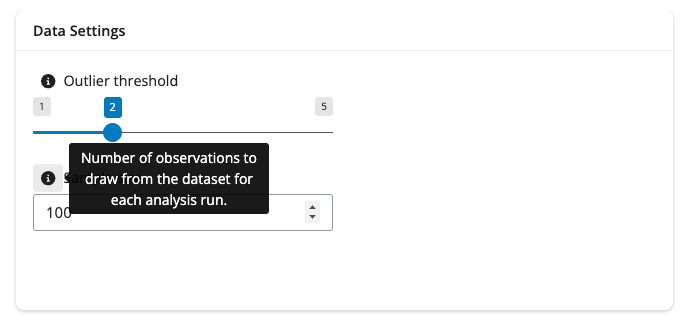
Toolbars in input labels#
You can also pass a toolbar as an input’s label to add an info button for additional information or provide quick actions, like resetting an input value.
|
|
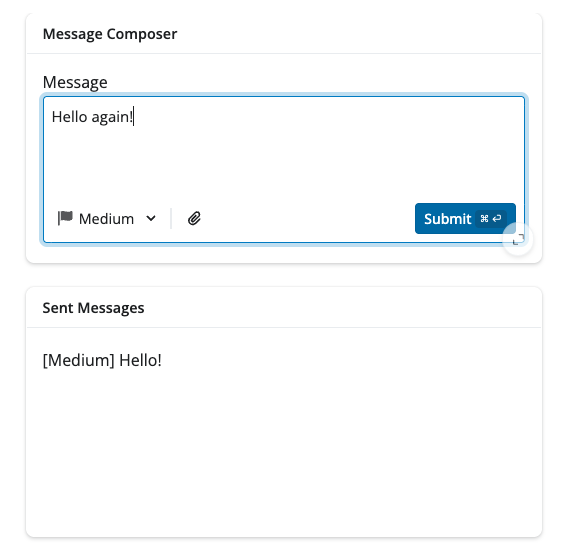
Toolbars in text areas#
The input_submit_textarea() component accepts a toolbar parameter directly, making it easy to add contextual controls for AI chat interfaces and message composers:
|
|
Toolbars are available in py-shiny and forthcoming in
bslib
for R. For a complete walkthrough with full app examples, see the
Toolbar component page
.
OpenTelemetry#
Starting with Shiny v1.6.0,
OpenTelemetry
support is built directly into the framework.
OpenTelemetry (OTel) is a vendor-neutral observability standard that lets you collect telemetry data — traces, logs, and metrics — and send it to any compatible backend. For Shiny apps, this means you can finally answer questions like:
- Why is my app slow for certain users?
- Which reactive expressions are taking the most time?
- How long does it take for outputs to render?
- What sequence of events occurs when a user interacts with my app?
Getting started#
The fastest way to get started is with Pydantic Logfire , which provides zero-configuration OTel setup:
|
|
Then set an environment variable to tell Shiny what level of tracing to collect:
|
|
That’s it — no changes to your app code required. Run your app and visit logfire.pydantic.dev to see traces.
OTel is great for GenAI apps#
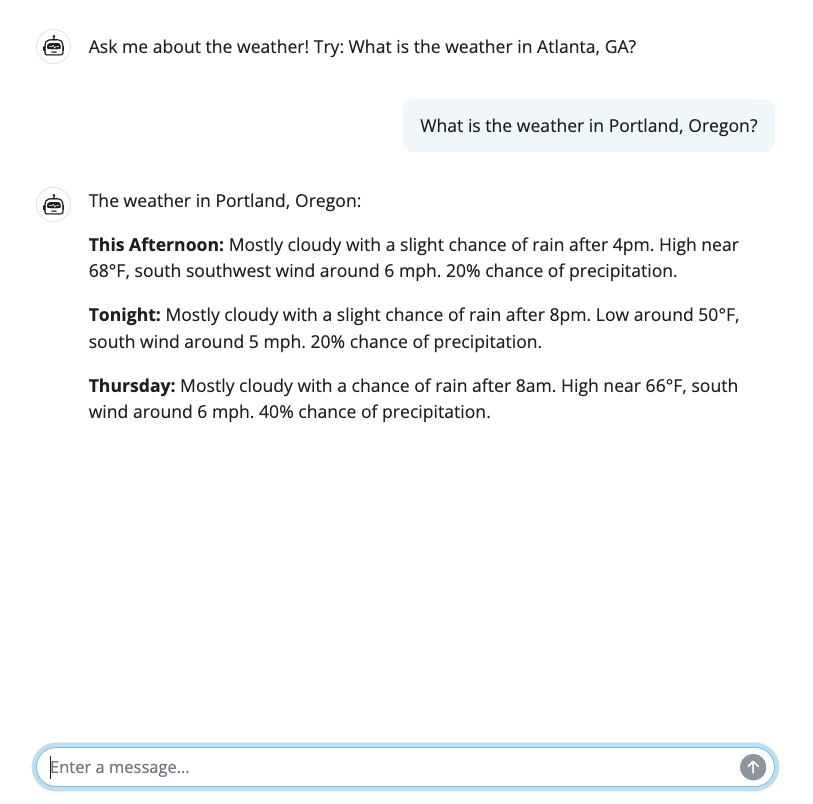
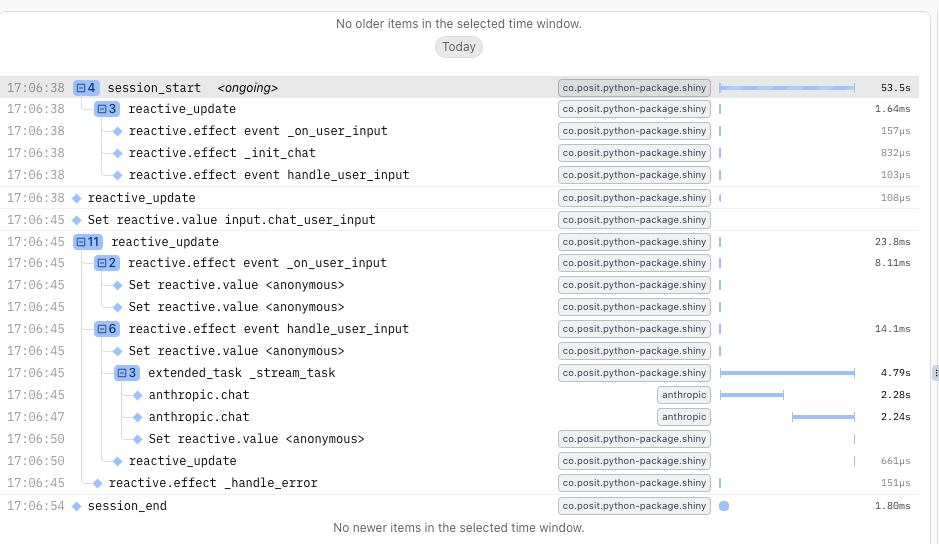
Shiny’s OTel integration pairs especially well with Generative AI applications. When a user reports that your chatbot feels slow, traces make it easy to pinpoint whether the delay is in the AI model request, streaming, tool execution, or a downstream reactive calculation.
The image below shows a trace from a weather forecast app powered by a Generative AI model. A single user session is captured in full detail:
SHINY_OTEL_COLLECT accepts three levels of detail:
"none"- No Shiny OpenTelemetry tracing"session"- Track session start and end"reactive_update"- Track reactive updates (includes"session"tracing)"reactivity"- Trace all reactive expressions (includes"reactive_update"tracing)"all"[Default] - Everything (currently equivalent to “reactivity”)
What gets traced automatically#
Shiny automatically creates spans for all of the following — no manual instrumentation needed:
- Session lifecycle: When sessions start and end, including HTTP request details
- Reactive updates: The entire cascade of reactive calculations triggered by an input change or a new output to be rendered
- Reactive expressions: Individual calculations such as
@reactive.calc,@reactive.effect,@render.*, and other reactive constructs
Works with any OTel backend#
Logfire is our recommended starting point, but Shiny’s OTel integration is fully vendor-neutral. You can send traces to Jaeger , Zipkin , Grafana Cloud , Langfuse , or any other OTLP-compatible backend.
For local debugging without a backend, install the OpenTelemetry SDK and use the console exporter:
|
|
Full documentation — including custom spans, database instrumentation, and production considerations — is available in the OpenTelemetry guide .
In closing#
We’re excited to bring you these new features in Shiny v1.6. As always, if you have questions or feedback,
join us on Discord
or
open an issue on GitHub
. Happy Shiny-ing!


