



We are absolutely thrilled to announce the release of ggsql 0.5.0, the first beta release of ggsql since the initial release back in April. While this release brings a lot of core improvements, the beta label marks the maturity of the project more than any specific feature in this release. That being said, the features included are exciting so let’s tell you all about them.
A new reader paradigm#
ggsql is modular by design with reader modules taking care of interacting with the various backends where your data live. We want ggsql to not be a monolith but instead be able to integrate itself into whatever data setup you or your organization uses, and readers is our way of making this happen.
We already showed this flexibility in the first release that included both a DuckDB, a SQLite, and a generalized ODBC reader. Since then we have added support for the new and more performant ADBC driver spec. Between this and ODBC it’s fair to say that all widely used databases are accessible, though work still remains to take full advantage of each database’s strengths.
One thing that was missing from our initial design was support for read-only database connections. ggsql heavily caches calculations on the backend using TEMP TABLE but this requires write access which you may not have. To fix this use-case ggsql 0.5.0 now includes a hybrid-reader mode. In this mode the initial data query is read from the backend database and then immediately transferred to an in-memory database of your choosing (e.g. DuckDB or SQLite) for further processing. This obviously helps in the cases where you don’t have write access to the backend, but can also speed up execution if your backend is not optimized for analytical queries. On the flip-side, it does incur an overhead when the data being plotted is huge.
You can turn on the hybrid mode by passing a cache-compatible reader to the --cache arguments in the CLI, e.g.
ggsql exec --reader odbc://... --cache duckdb` "VISUALIZE ..."or by prefixing it to the reader url separated by a + in the kernel:
-- @connect: duckdb+odbc://...
VISUALIZE ...
We are excited by what this new setup offers, both in allowing more users to use ggsql, but also when looking ahead and thinking about interactivity in ggsql graphics where you might rightfully not want to hit your database backend every time a user hovers over your plot somewhere.
A new writer enters the stage#
While the improvements in the reader setup may be largely invisible to the user, another foundational change will surely command attention. ggsql has since its inception relied on Vega-Lite for the actual rendering. This meant that ggsql converted the query into a json spec and handed it off to the Vega-Lite JavaScript library for further processing. This choice meant that we could iterate quickly on the core of ggsql without getting bogged down by the complexity of actual rendering. From the start we knew that Vega-Lite was not meant to be the only writer in ggsql, but as development progressed it became clear that it was unsuitable in general and had to be completely replaced. Thus, I have spent my summer creating a new writer, which in time will replace Vega-Lite completely. The benefits of this are already many (and we will go through them below), but the effort will also continue to pay dividends as we are more free to support the features we deem relevant without relying on underlying support from another library.
File type galore#
Outputting a JSON spec for further JavaScript processing is reasonable if you target a live HTML document but otherwise a user would generally expect an image of some sort. With the new writer we are finally able to provide this out of the box.
And we haven’t stopped at PNG…
The new writer is capable of rendering PNG, JPEG, TIFF, WebP, SVG, and PDF documents out of the box, hopefully serving all your export needs. The SVG output is optimized for further editing in vector graphics software, while the PDF output is optimized for stable rendering across machines and thus automatically embeds the glyphs used in the document.
Output type is automatically deduced from the file extension in the CLI, so you can for instance create a PDF version of a plot directly with
ggsql exec --output plot.pdf "
VISUALIZE bill_dep AS x FROM ggsql:penguins
DRAW density"
In Positron, the new formats are available as export options from the plot pane.
A native viewer#
While not an output format per se, the new renderer also allows to output to a native window for previewing, directly from the CLI. This functionality can be accessed with the new view command to ggsql, e.g.
ggsql view "
VISUALIZE bill_dep AS x FROM ggsql:penguins
DRAW density"
Plotting capabilities enabled by the new writer#
While the different output modes are the direct effect of a writer that can render to more formats, the new writer also provides pure, dataviz bliss by raising the ceiling for what can be plotted. This was our main reason for moving away from Vega-Lite and the reason why we can’t keep the old writer around forever — it is simply not capable enough. We will continue to reap the benefits of this in the future, but we have already included some in this release:
Rich text support through extended markdown#
Text is important in data visualizations. This position should come as no surprise to those who have followed my years of trying to improve the font and text rendering capabilities of R. Just because we have moved to SQL doesn’t mean that I have given up on that quest. Thus, the new writer has full support for markdown, along with modern font support including font features and font variations. As the latter two are still not reachable from ggsql we’ll focus on the markdown support here.
By default, markdown parsing is turned on in all titles and labels, but not in break labels. Once we settle on a theming system this will all be configurable, though. Lastly, markdown parsing can also be turned on for the text layer by setting parse => true. The markdown is heavily inspired by the flavor I developed in the R marquee package. This means that everything you expect from standard markdown is available, plus a number of enhanced features:
- Italic (
*), Bold (**), Underline (_), Strikethrough (~~), Subset (~), Superset (^),code(`), Links ([text](url)) - Headings 1 — 6 (
#—######) - Quote blocks (
>) - Code blocks (
```) - Bullet lists and numbered lists (
-or*for former,1.for latter) - Horizontal lines (
* * *) - Images (
)
From marquee it gains the support for ad-hoc coloring and sizing through the custom span syntax: {.red I'm colored red} and {#0000FF I'm colored blue} allows for named and hex-encoded colors to be set on a piece of text, and {.40 I have big letters} lets you set a font size on the fly. The customization provided by the writer goes even deeper but again, the bottleneck right now is the theming system, not the renderer. Let’s see it all in action:
VISUALIZE species AS fill, species AS x FROM ggsql:penguins
DRAW bar
SCALE fill TO ('steelblue', 'goldenrod', 'forestgreen')
LABEL
title => ' Distribution of penguin (*Pygoscelis*) species',
subtitle => 'This plot focuses on 3 species: {.steelblue *P. adeliae*}, {.goldenrod *P. antarcticus*}, {.forestgreen *P. papua*}'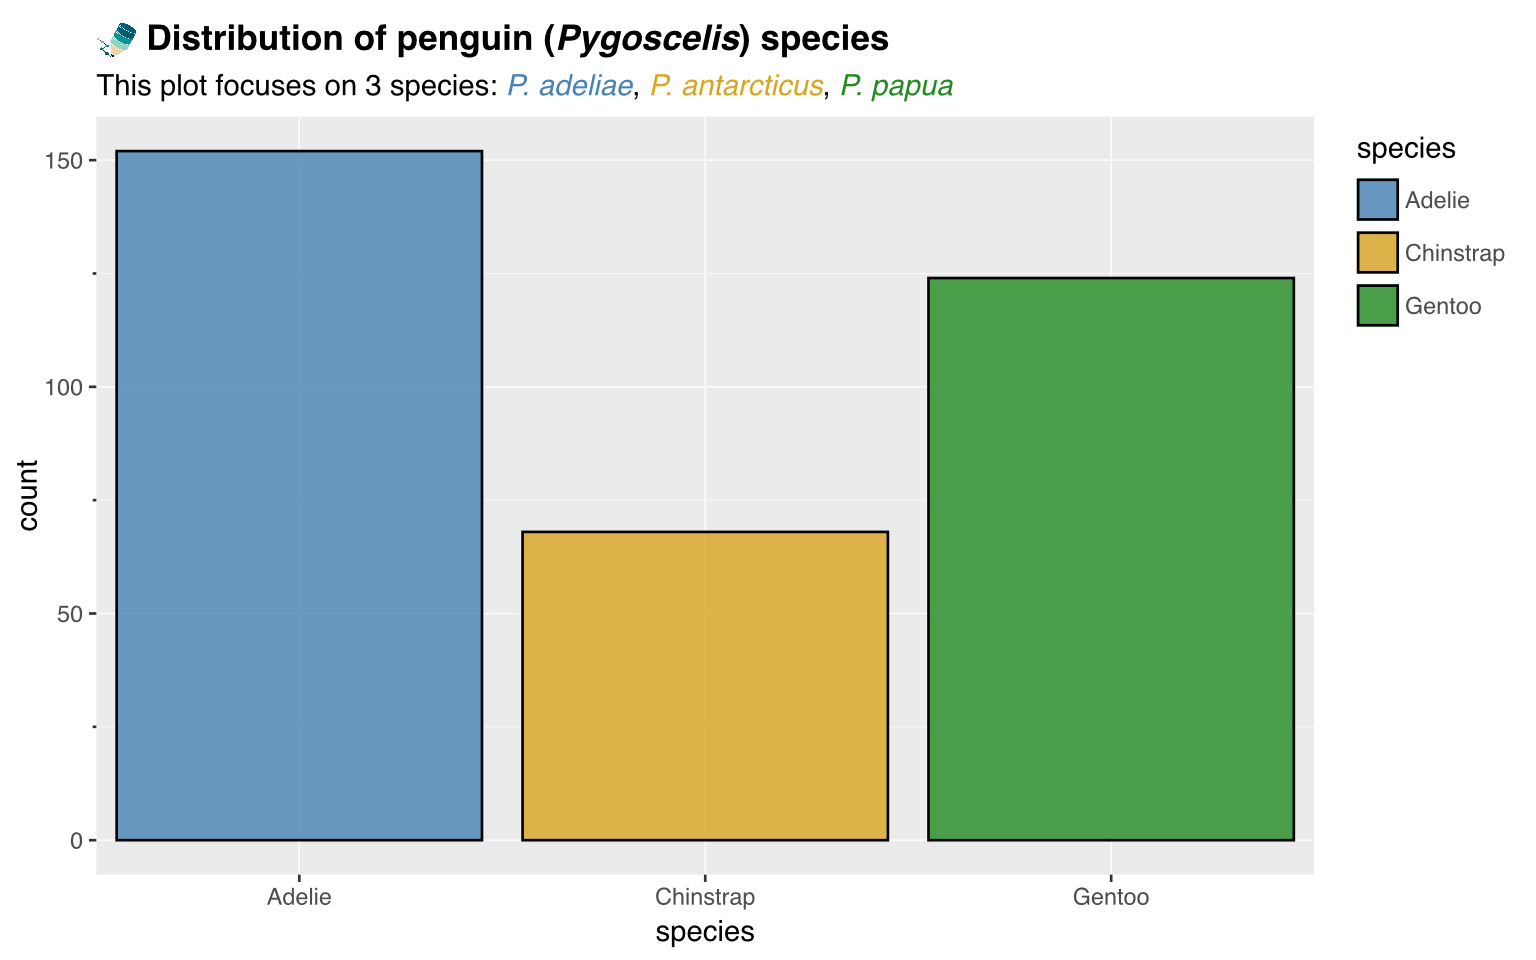
Support for captions#
A small but clear deficiency of Vega-Lite was the lack of support for captions. Captions are often used to provide source information for the data, so that it travels along with the visualization:
FROM ggsql:penguins
VISUALIZE species AS fill, bill_dep AS x, bill_len AS y
DRAW point
LABEL
  caption => 'Data source: [Gorman KB *et al.*](www.doi.org/10.1371/journal.pone.0090081)'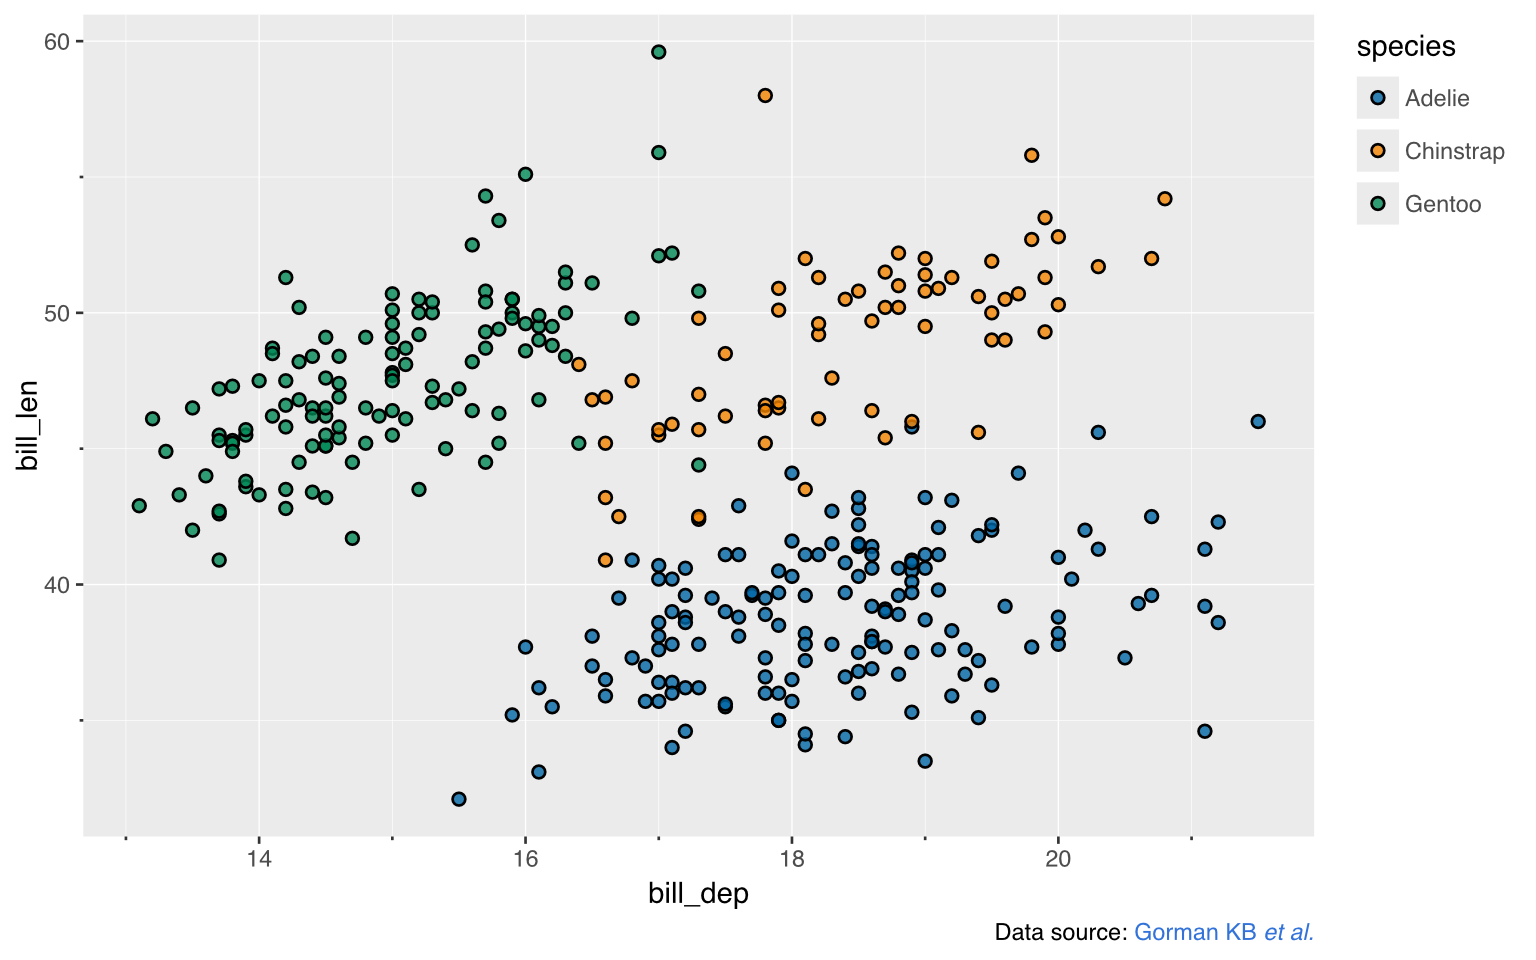
A render-specific side note. If you export the above to either SVG or PDF the included link will be live and take you to the article.
Minor breaks are now supported#
Visible, but ignored in the two preceding examples is the appearance of minor breaks in the output. This concept doesn’t exist in Vega-Lite and we have thus waited for a new renderer to turn it on. The interface is much like the major breaks: provide a count or an array of exact locations for the minor break to appear:
FROM ggsql:penguins
VISUALIZE species AS fill, bill_dep AS x, body_mass AS y
DRAW point
SCALE x
  SETTING minor_breaks => 3
SCALE y
  SETTING minor_breaks => (3200, 4200, 5200)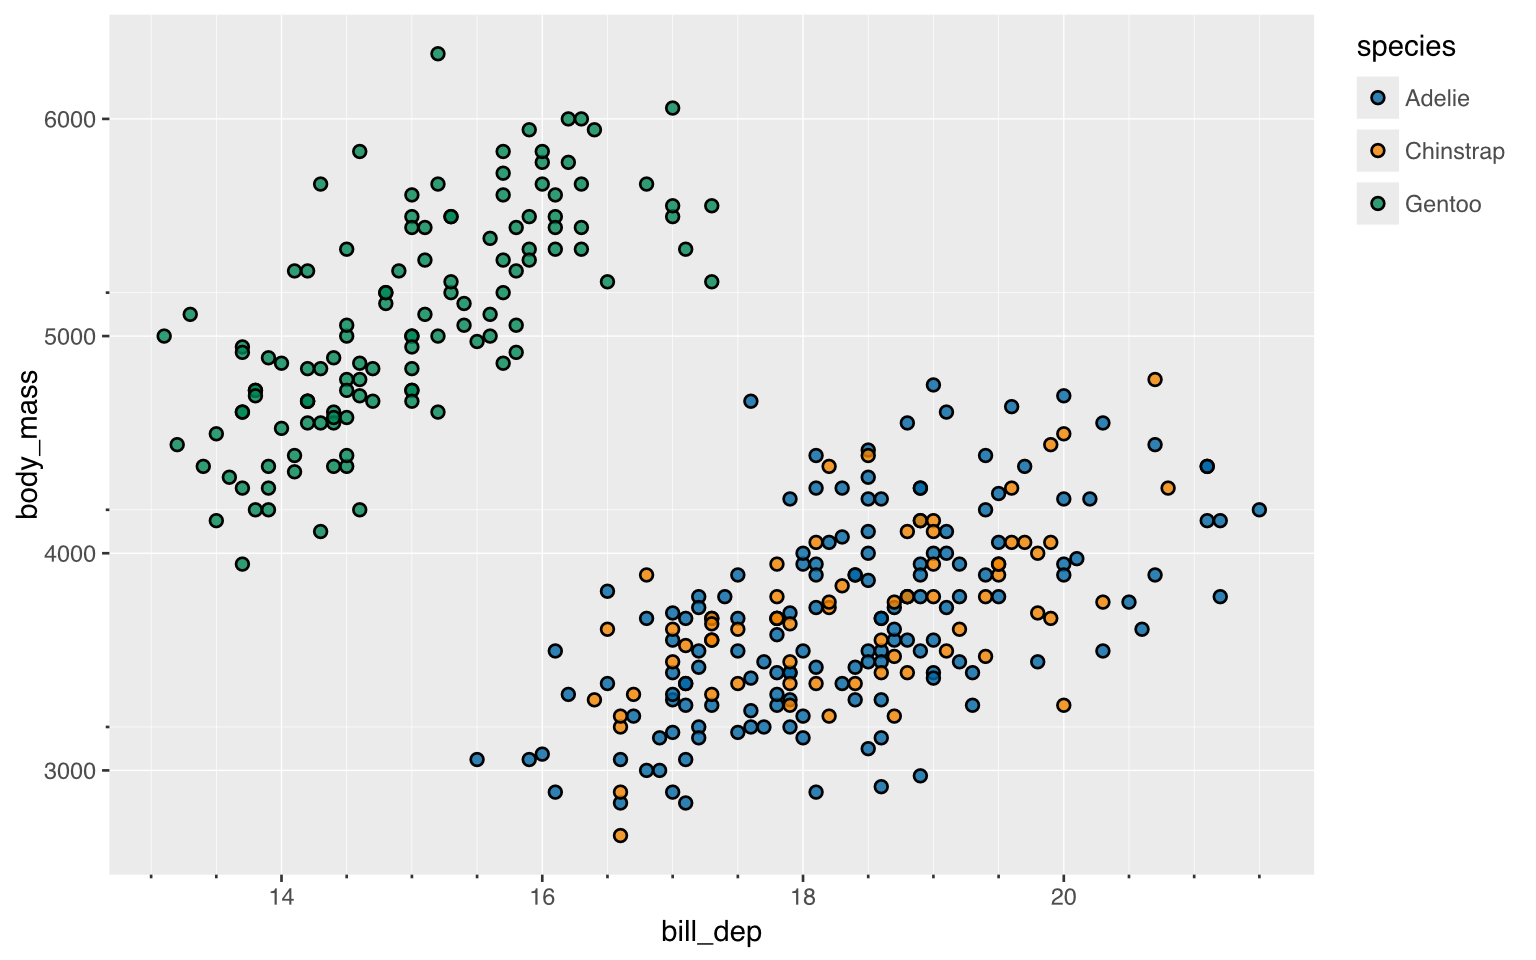
True variable line aesthetics#
The old renderer, like ggplot2, supported varying width and color along a line by chopping it up in small segments. This pragmatically works, but the only way it can look correct is to use round end caps which both forces round corners and destroys transparency due to segment overlap. In the new renderer I’ve gone out of my way to make this look correct, by converting the line into a mesh and rendering it as triangles. This means that gradient and variable width lines are now fully supported at the low level and not through any hacks:
VISUALIZE Date AS x, Temp AS y FROM ggsql:airquality
DRAW line
  MAPPING Ozone AS stroke, Wind AS linewidth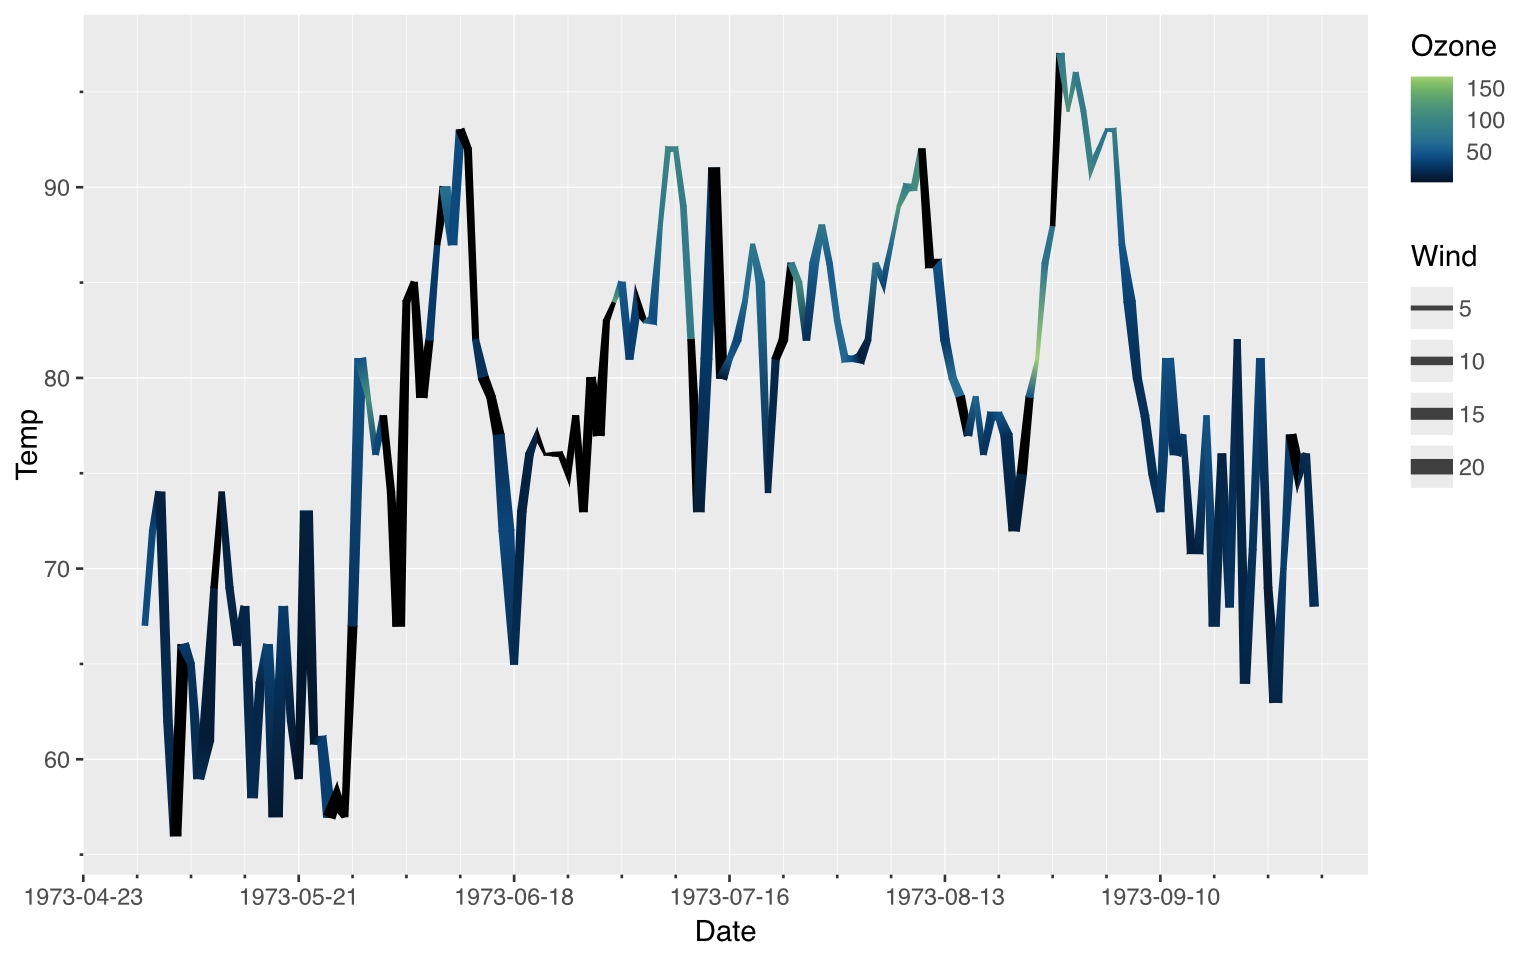
(not endorsing the above visualization in any way)
Looking forward#
We have covered a lot of ground in the 5 months or so since the first release, but we have much to add still and we can’t wait. Without really going into details with any of them, I see 3 major efforts leading up to ggsql exiting beta, along with the myriad of smaller enhancements that are sure to come along:
- Support for table output. As recently showcased in my posit::conf(2026) talk we are actively working on bringing the table formatting features from gt great-tables. This will allow you to format publication quality tables directly from your SQL query and make pure (gg)SQL driven reports an obvious option for many use cases.
- Plot composition. One plot is good, many plots are (sometimes) better. Inspired by what the R patchwork package has done for ggplot2 plots we want to allow composition of plots, tables, and perhaps more. Who knows if one day a single SQL query can create a beautiful dashboard. The good news is that the new renderer has all of the composition logic built in already (faceting is done through that API), so much of this is a question of landing the right syntax (something we take extremely seriously).
- Interactivity. For certain tasks, interactivity is a superior solution (though not for all). ggsql does not aim to be a D3-like playground for highly customized interactive visualization, but it does want to allow visualizations to be interactive to the extent the syntax allows without collapsing. I’m really looking forward to this design work.
These are the main focus for us, but the writer switch has itself offered so much low-hanging fruit for us to pick, that there will be plenty of user visible additions over the next year.