


We’re bringing OpenTelemetry to R. As a Posit-wide initiative across our open source packages, we’ve instrumented some of the most widely-used R packages for production workloads – Shiny, plumber2, mirai, httr2, ellmer, knitr, testthat and DBI. You can add observability to your R applications with no code changes: set a few environment variables and you get traces, logs, and metrics flowing to the backend of your choice.
This is part of our commitment to R in production. As R applications scale – more users, more processes, more machines – you need tools to understand what’s happening across your entire system. That’s what OpenTelemetry is built for, and it’s now available for R.
What is OpenTelemetry?#
OpenTelemetry (OTel) is a vendor-neutral, open source observability framework backed by the Cloud Native Computing Foundation. It has broad industry support across languages and platforms, and is already the standard in the Python, Java, JavaScript, and Go ecosystems. Now it’s available for R.
OpenTelemetry defines a standard for collecting telemetry data:
- Traces follow an operation as it moves through your system, showing exactly which functions ran, in what order, and how long each took.
- Metrics capture numerical measurements over time – things like request counts, response latencies, or memory usage.
- Logs record detailed events as they happen, providing context when you need to investigate a specific moment.
The instrumented packages described in this post all use the otel package under the hood, and focus on traces, which provide the most immediate value for understanding production behavior. You can also use otel directly to add your own metrics and logs to your application code.
Why observability matters for R in production#
When you’re developing interactively in RStudio or Positron, debugging is straightforward – you can step through code, inspect objects, and add print statements. But when your R code runs in production – a Shiny app serving hundreds of users, a plumber2 API handling thousands of requests, a batch pipeline running across a cluster – the picture changes.
The core concept in OpenTelemetry is a trace: the full path of a request through your system. Each trace is made up of spans – individual units of work with a name and a duration. Spans nest inside each other, so you can follow how each operation triggered the next:

This structure gives you four things that are hard to get any other way:
- Performance: Which part of a request is slow? Span durations pinpoint where time is spent – and nesting reveals unnecessary overhead.
- Errors: In development and testing, you know where errors are – you wrote the test, you control the inputs. In production, errors surface far from their root cause, across process boundaries and async operations, triggered by conditions you never anticipated. Traces show you the full chain of real operations that led to each failure, in the context where it actually happened.
- Centralized view: When your application extends across multiple R processes or machines – a Shiny app with mirai workers, or a plumber2 API behind a load balancer – traces are aggregated into a single view across all of them.
- Real-time monitoring: OTel is designed to be left on in production, not just enabled during testing or staging. With low overhead, it runs continuously – so you see what’s happening as it happens, and dashboards and alerts catch problems before users report them.
Instrumented packages#
We’ve worked across teams to add OpenTelemetry instrumentation to the R packages where it matters most:
| Package | Version | What it traces |
|---|---|---|
| Shiny | ≥ 1.12.0 | Session lifecycle, reactive updates, reactive expressions, background tasks |
| plumber2 | ≥ 0.2.0 | API request handling, routing, endpoint execution |
| mirai | ≥ 2.5.0 | Task dispatch, daemon execution, results |
| httr2 | ≥ 1.2.2 | HTTP requests and responses |
| ellmer | ≥ 0.4.1 | LLM API calls, tool execution, token usage |
| knitr | ≥ 1.51 | Document rendering, chunk evaluation |
| testthat | ≥ 3.3.2 | Test execution |
| DBI | ≥ 1.3.0 | Database queries and connections |
Together, these packages cover the most common production R workloads: web applications, APIs, parallel computing, HTTP clients, AI/LLM tools, report rendering pipelines, CI test runs, and database access. Because the instrumentation is built into the packages themselves, you benefit from it automatically – no wrapper functions, nor modifications to existing code. If you already have a Shiny app or plumber2 API, your app will generate traces as soon as you enable OpenTelemetry. Your application code stays exactly as it is.
Seeing it in action#
To make this concrete, let’s look at a Shiny chat app built with shinychat and ellmer that fetches weather forecasts. It uses mirai for async execution and httr2 for weather API requests.
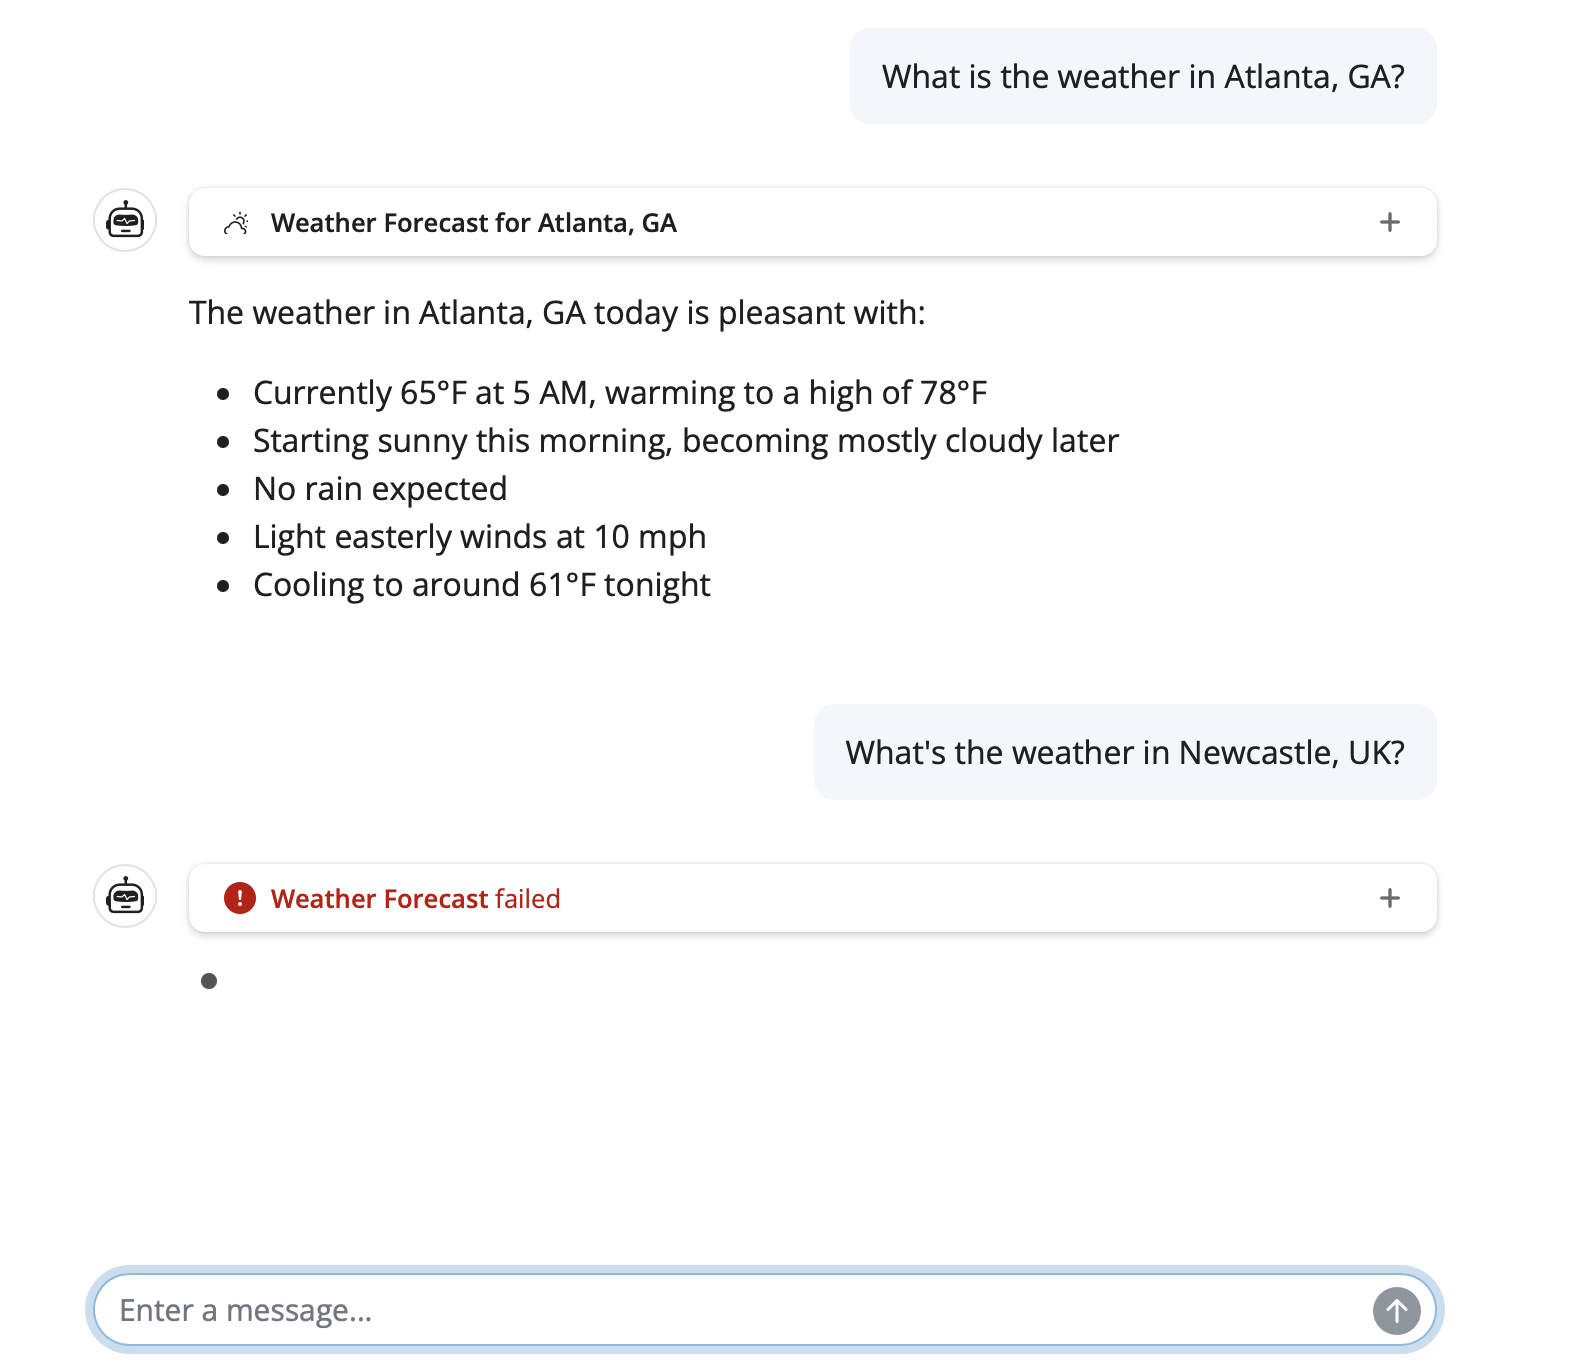
A user asks about the weather in Atlanta and Newcastle:
With OpenTelemetry enabled, every step is captured automatically. Here are the traces from those two queries:
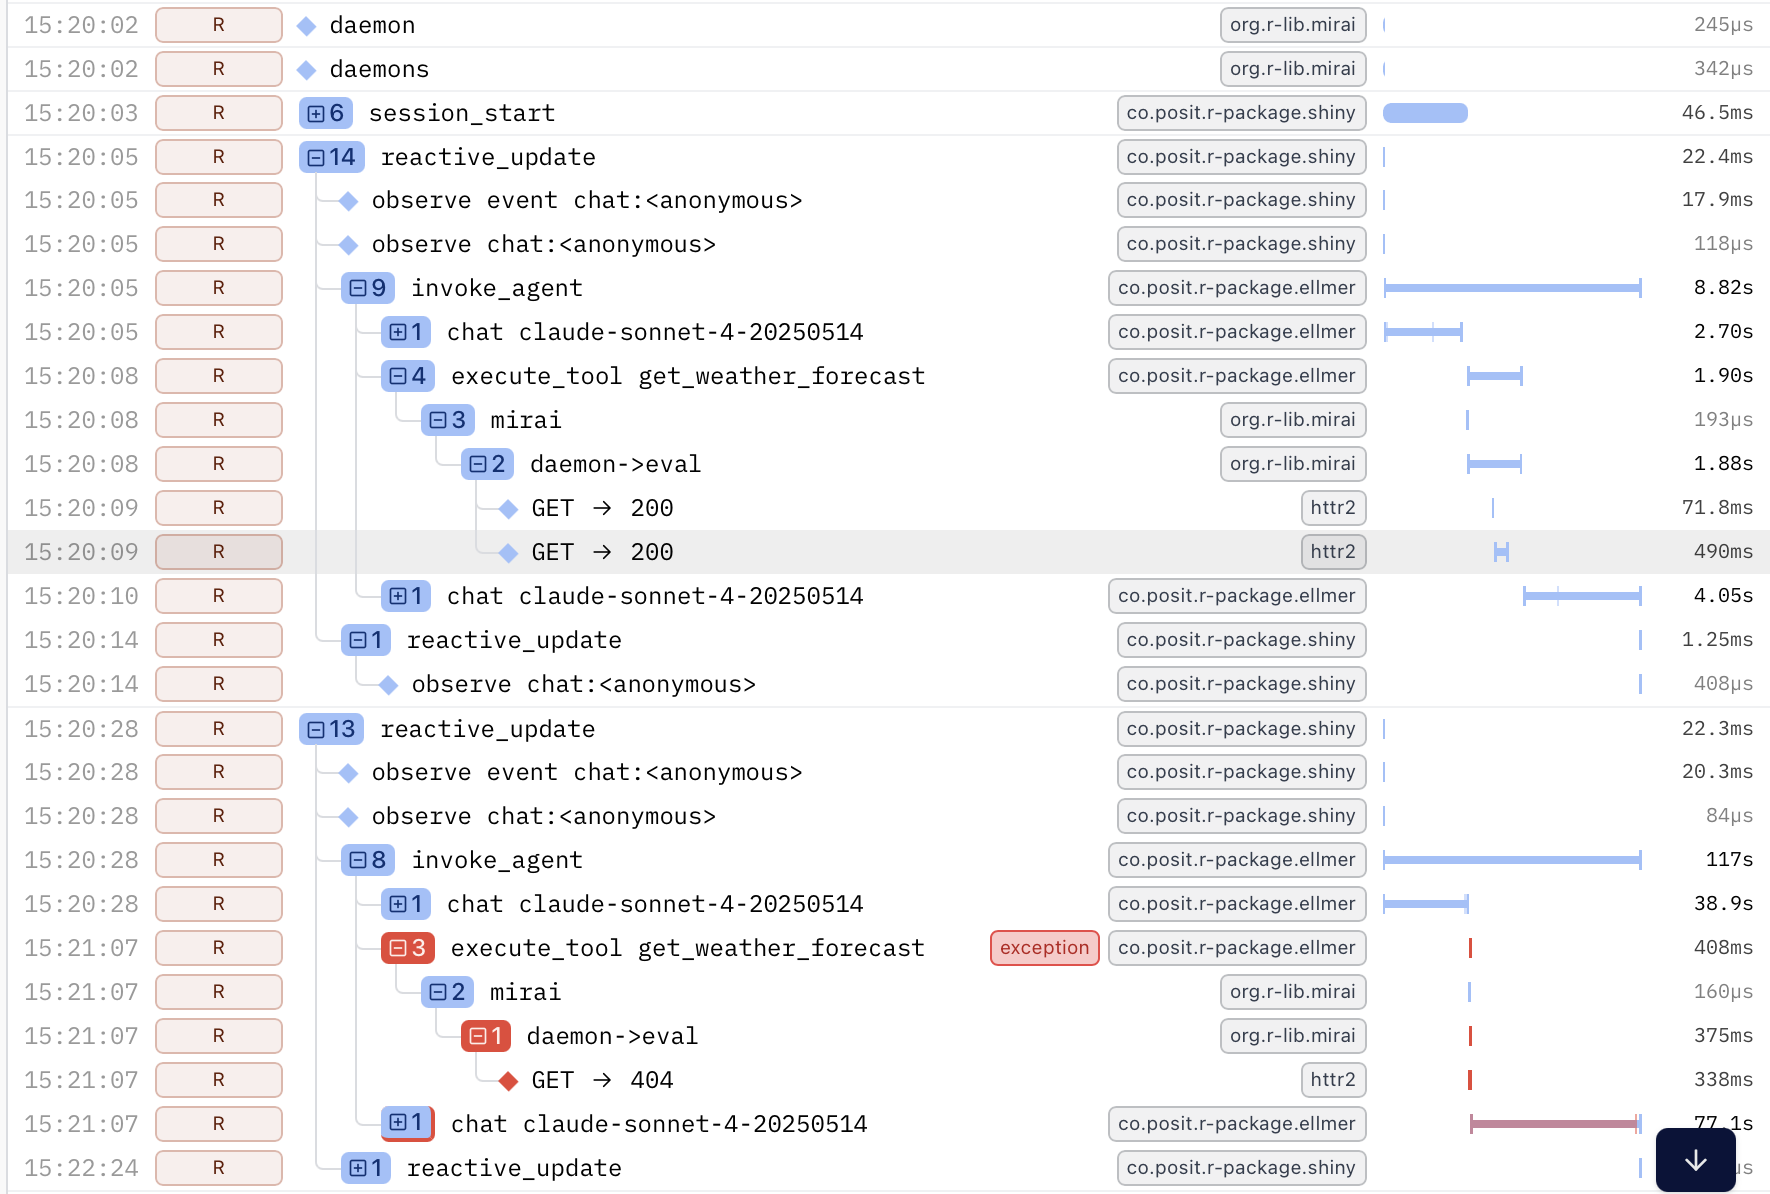
The trace reveals the full chain of operations from user input through to the HTTP request, across process boundaries, with no manual logging. The nesting shows how each step triggered the next, and the durations show where time was spent.
The second query failed. Without tracing, you’d see an error in your logs and start investigating. Here, the failure is immediately visible – the red span pinpoints where it occurred and the surrounding context shows why. In a production system with many concurrent users, that’s the difference between minutes and seconds of debugging.
Getting started#
Getting started requires the otelsdk package and a few environment variables. No changes to your application code.
Here’s how the pieces fit together: the instrumented R packages generate telemetry data as they run. The otelsdk package collects and exports this data over HTTP to a backend – a service that stores your traces and provides a web dashboard where you can search, filter, and visualize them (like the trace screenshots above).
Step 1: Install otelsdk#
install.packages("otelsdk")Step 2: Choose a backend#
OpenTelemetry is vendor-neutral, so you can send your data to any compatible backend:
- Cloud services: Logfire, Grafana Cloud, Langfuse
- Self-hosted: Jaeger, Zipkin, Prometheus
During development, you can also run an OpenTelemetry Collector on your own machine and inspect traces directly, without sending data anywhere else.
Each backend will give you an endpoint URL and an authentication token. The otelsdk collecting telemetry data guide has examples for some common backends.
Step 3: Set environment variables#
Add these to your .Renviron file (use usethis::edit_r_environ() to open it), replacing the endpoint and token with the values from your chosen backend. This example uses Logfire, which offers a free tier to get started:
OTEL_TRACES_EXPORTER="http"
OTEL_EXPORTER_OTLP_ENDPOINT="https://logfire-eu.pydantic.dev"
OTEL_EXPORTER_OTLP_HEADERS="Authorization=<YOUR-WRITE-TOKEN>"
If you’re deploying content to Posit Connect, refer to how to set environment variables on Posit Connect.
Step 4: Run your app#
That’s it. Restart R, then run your Shiny app, plumber2 API, or any code that uses the instrumented packages. Traces will flow to your backend automatically. Open your backend’s web dashboard to see them – you’ll see a view like the trace screenshots shown above, with each span representing an operation in your application.
You can verify that tracing is active at any time:
otel::is_tracing_enabled()
#> [1] TRUE
OpenTelemetry is designed to be safe in production. If anything goes wrong in the telemetry code itself, it will never crash your application – errors are silently suppressed so your app keeps running.
Zero-code instrumentation#
Beyond the packages that ship with built-in instrumentation, otel supports zero-code instrumentation for any R package. Set the OTEL_R_INSTRUMENT_PKGS environment variable to a comma-separated list of package names, and otel will automatically create spans for their exported functions:
OTEL_R_INSTRUMENT_PKGS=dplyr,tidyrYou can also fine-tune which functions are instrumented using include and exclude filters:
OTEL_R_INSTRUMENT_PKGS_DPLYR_INCLUDE=mutate,filter,selectThis is useful for adding visibility to any package in your stack, even those without built-in OTel support. See the otel documentation for full details.
Configuration options#
The otelsdk package is configured entirely through environment variables, following OpenTelemetry conventions:
| Variable | Purpose |
|---|---|
OTEL_TRACES_EXPORTER |
Exporter type for traces (e.g. "http") |
OTEL_LOGS_EXPORTER |
Exporter type for logs |
OTEL_METRICS_EXPORTER |
Exporter type for metrics |
OTEL_EXPORTER_OTLP_ENDPOINT |
URL of the OTLP-compatible backend |
OTEL_EXPORTER_OTLP_HEADERS |
Authentication headers for the backend |
OTEL_R_INSTRUMENT_PKGS |
Packages for zero-code instrumentation |
OTEL_R_EMIT_SCOPES |
Restrict telemetry to specific packages |
OTEL_R_SUPPRESS_SCOPES |
Exclude specific packages from telemetry |
See the otelsdk environment variables reference for the complete list.
Looking ahead#
With instrumentation built into the packages that R users already rely on, observability becomes something you can turn on, not something you have to build.
We’re also integrating an OpenTelemetry collector into Posit Connect, giving you an end-to-end observability solution you can simply turn on or off.
OTel support across the ecosystem continues to expand. If you’d like to learn more:
- otel package documentation – the instrumentation API
- otelsdk package documentation – the SDK for collecting and exporting telemetry
- Shiny 1.12 OTel blog post – deep dive into Shiny’s OpenTelemetry support
- OpenTelemetry project – the upstream standard
We’re excited about what this opens up for the R community. Whether you’re running a Shiny dashboard for a small team, a plumber2 API serving thousands of requests, or a data pipeline distributed across a cluster – you now have the tools to see what’s happening, in real time, with no code changes required.