The 2024 Plotnine Contest will close in 5 days on 26th July 2024, this is after a two week extension.
We have many
submissions already but we could have move in these two categories.
1. Visualisation of Distributions#
Most of the time, the main plot of statistical graphics is to get a sense of how the data is distributed. I would love to see more submissions of this type. This resource
from the University of Iowa is a good introduction to the kinds of ways you can visualise distributions. I think there is plenty of room for otherwise simple visualisations of data distributions made more compelling by the choice of dataset, colors, annotations and overall polish.
2. Visualisation Art#
Plotnine implements The Grammar of Graphics, which moulds Drawing and Painting Art into a system suitable for statistical graphics. Constrained within, the Art says “I want to break free” and a contest is the party at which to break free. We got all week.
A contest can trigger you into action on tasks you’ve long procrastinated or avoided due to concerns about developing an unhealthy addiction. This one may have got me. Inspired by a Yan Holtz
piece, Michael Chow
has deeped into generative art for this contest. In turn, I have given it a go.
From Yan and through Michael, I get an abstract form and first I unpaint it to reveal its spiky nature.
The Spiky World#
Code
 1
 2
 3
 4
 5
 6
 7
 8
 9
10
11
12
13
14
15
16
17
18
19
20
21
22
23
24
25
26
27
28
29
30
31
32
33
34
35
36
37
38
39
40
41
42
43
44
45
46
47
48
49
50
51
52
53
54
55
56
57
58
59
60
|
from plotnine import (
    aes,
    coord_cartesian,
    element_rect,
    geom_area,
    ggplot,
    scale_color_manual,
    theme_void,
    theme,
)
import pandas as pd
import numpy as np


num_groups = 30

def get_colors(cmap_name, start=0, stop=1, n=10):
    """Return colors from a colormap"""
    from mizani.palettes import get_colormap
    x = np.linspace(start, stop, n)
    return get_colormap(cmap_name).continuous_palette(x)

def combine(colors: list[str]):
    from mizani.palettes import gradient_n_pal
    x = np.linspace(0, 1, num_groups)
    return gradient_n_pal(colors)(x)

def make_data(seed=123):
    names = [f"G{i}" for i in range(num_groups)]
    population = [0] * 100 + list(range(1, num_groups+1))
    rs = np.random.RandomState(seed)
    frames = []
    for i in range(30):
        arr = rs.choice(population, num_groups)
        _data = pd.DataFrame({
            "x": i,
            "y": arr / np.sum(arr),
            "g": rs.choice(names, num_groups, replace=False),
        })
        frames.append(_data)
    return pd.concat(frames).sort_values(["x", "g"])

def blink(colors: list[str] | list[list[str]], seed=123):
    data = make_data(seed)
    p = (
        ggplot(data, aes(x="x", y="y", fill="g", color="g"))
        + geom_area(show_legend=False)
        + coord_cartesian(expand=False)
        + scale_color_manual(values=combine(colors), aesthetics=["fill", "color"])
        + theme_void()
    )
    return p

(
    ggplot(make_data(), aes(x="x", y="y", group="g"))
    + geom_area(fill="white", color="black", show_legend=False)
    + coord_cartesian(expand=False)
    + theme_void()
    + theme(plot_background=element_rect(fill="white"))
)
|

Then with each blink of the eye, The Spiky World reveals one of her infinite faces.
Blink.
Spiky Desert Dunes#
Code
1
|
blink(get_colors("inferno", .5, 1)[::-1])
|

Blink.
A Spiky Volcano#
Code
1
|
blink(get_colors("magma", .3, .95))
|

Blink.
A Morning in a Spiky Forest#
Code
1
|
blink(get_colors("Greens"))
|

Blink.
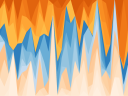
A Spiky Sunset at the Beach#
Code
1
2
3
4
5
|
blink([
    *reversed(get_colors("YlOrBr", 0.4, 0.7)),
    *reversed(get_colors("Blues", 0.25, 0.7)),
    *reversed(get_colors("Oranges", 0.05, 0.3)),
])
|

This is generative art, the art that never ends. I did not know. I started blinking. I must continue blinking forever.
Create your world, blink and share
what you see.